For some time, the key metric used by major giving fundraising teams has been Number of Visits Made This Fiscal Year-to-Date. But now with COVID-19 restrictions, you can’t visit your prospects anymore. So what CAN you do? What should you be measuring now that your key metric doesn’t apply?
We’ve discussed this with a number of our clients, and when we dig into the data, we find two things:
- Number of Visits actually never has been the best indicator of whether a meaningful contact actually occurred
- Successful teams go well beyond visits and interactions and work with more strategic performance drivers
Better Than Visits >> Meaningful Contacts
The reason for measuring visits is to track meaningful interactions happening within the portfolios of your assigned prospects. Historically, the sector has assumed a face-to-face “visit” to be meaningful and phone or email less so (or in many cases not at all). But is this accurate? What if the visit was “I bumped into Bob at homecoming,” while a phone call was “spent 90 minutes on the phone with Sue and got her commitment on a $100,000 gift to the engineering school”? We see this a lot and have come to the conclusion that prospects can be advanced equally as well by phone, digital, and correspondence as with actual face-to-face visits. And this is particularly true right now when teams can’t make visits.
So more and more of our clients have been creating a new category of “meaningful connection” by writing it out in the contact notes. Whether it was a visit, a phone call, or an email dialog, if meaningful two-way dialog occurred, it counts.
To begin measuring this accurately, some fundraisers have had prospect research team members review the contact notes and manually flag key interactions as “meaningful.” We prefer to automate the process by parsing out the contact notes each day, using text-parsing algorithms. With smart automated parsing, you can extract these meaningful interactions directly out of the contact notes. (Some have suggested having the field officer flag their own contacts as “meaningful,” but we don’t recommend that, as it is unlikely to produce accurate outcomes.)
We consistently find the best data is the content of what actually happened during the contact. And if that’s not being recorded in the notes, it should be. Writing that down is a core part of developing strategies to move prospects forward.
For example, a few weeks ago we were doing a QBR with a client that had added a new contact type option, calling it meaningful email-phone-online. Six weeks in to the COVID-19 situation, their donor reports showed visits were at zero but meaningful email-phone-online had remained at the same level as visits had been in the past. That’s not surprising, of course, but reading the contact notes revealed some important details. Even without visits, prospects were still being cultivated and donors were being progressed forward… which is what it’s all about.
We’ve developed a Portfolio Penetration Chart to help clients determine the progress made across their portfolios. The rating is based on whether there was a significant connection or not with each assigned prospect in the past 12 months. In the example chart below, there are five levels of “penetration”:
Blue = has an active solicitation and had a meaningful contact in the past 12 months. This should be about 25% of a typical portfolio of ~100 prospects. In the example below, only a handful of portfolios are at or close to that level; many are not. Why do you think that might be?
Light Blue = active solicitation, but no meaningful contact in over a year. This is a warning sign!
Green = meaningful contact, but no active solicitation yet. Should be ~50% of the portfolios. What do you see?
Orange = minor contact in the past 12 months; usually a “reach” attempt.
Gray = no contact at all. Should be <10%–15%, and only new qualification prospects.
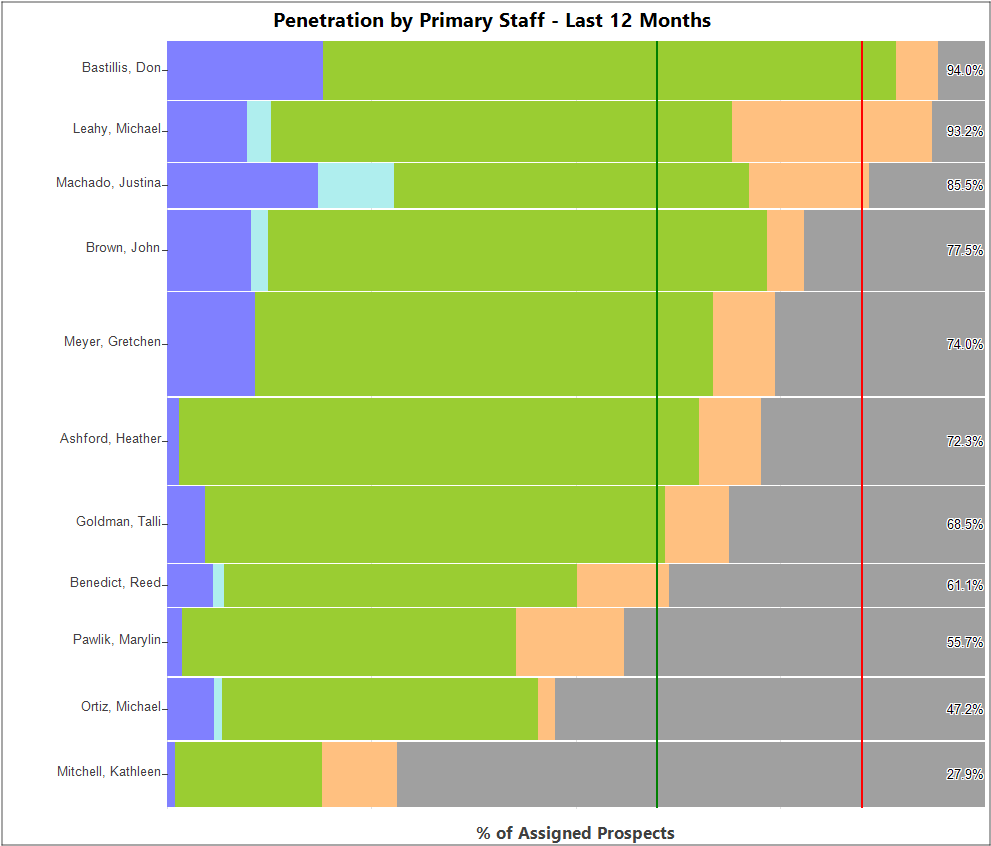
In the Portfolio Penetration Chart above, gray represents assigned prospects who have had no contact at all during the past 12 months. What do you think might be going on? The beauty of this system is that you can find out by clicking and drilling down into the prospect lists and exploring their various ratings and attachment scores. In many of these portfolios, you’d find those in the gray are disengaged or disconnected prospects who should be reassigned to a mid-level annual program for further cultivation… the field officers are actually making a rational decision to focus their efforts elsewhere. Their portfolios should be rebuilt. So here’s the question: Would measuring just visits have picked this up?
Reports like this are encouraging! It means that your work as a fundraiser isn’t lost. But it does mean adjustments are needed. Most donor interactions will be by phone, text, virtual meeting, or email/mail—at least for the short term. You’ll need to engage with your donors in ways that are significant and then track these interactions in ways that show you the full picture. It’s possible that once the COVID-19 situation resolves, we will be able to return to many of our usual donor development practices. However, if we can learn to adapt and find additional ways to make meaningful—if transformed—connections with donors, our strategy will be much stronger for the long haul.
Performance Drivers
Taking this one step further, focusing primarily on visits and contacts—no matter how they are measured—usually will NOT produce superior results. In fact, we’ve got direct evidence that goals based on “field officer activity counts” can actually be detrimental. We’ve done all kinds of research and recommend that teams move away from activity metrics and toward performance drivers. Things like:
- Are our portfolios appropriately sized? Are all of our top prospects covered?
- What percentage of our portfolios is being connected with in a meaningful way in, say, a year? (See the client example above.)
- How rapidly are prospects advancing through stages? Do we have good balance across our stages?
- How do our ask amounts compare to projected dollar amounts calculated from capacity and engagement and recent giving patterns?
- How well and efficiently are we closing?
Getting this right will focus your team and will bring out stories and best practices, allowing the field officers learn and grow together. The result is strong a ROI, because as more larger gifts come in, revenue increases, efficiency (cost/revenue) improves, and the pace of fundraising picks up.
For more information on performance drivers, check out “Change Management in Major Giving” or “Key Metrics in Major Giving … and Why Visits This Fiscal Year Should NOT Be One of Them.”
Looking to Amplify Your Major Giving Program?
Most organizations are working to re-forecast based on best guesses related to the impact COVID-19 will have on revenue and fundraising programs—but guesses are simply not good enough. Pursuant is committed to help you ground your decisions in data that is complete and accurate.
The current environment may feel uncertain, but it is our collective responsibility to provide strength and stability—for each other, our donors, and, most of all, the constituents we serve.
Get in touch with us today to ensure you are equipped with the insights you need to not only survive, but thrive.